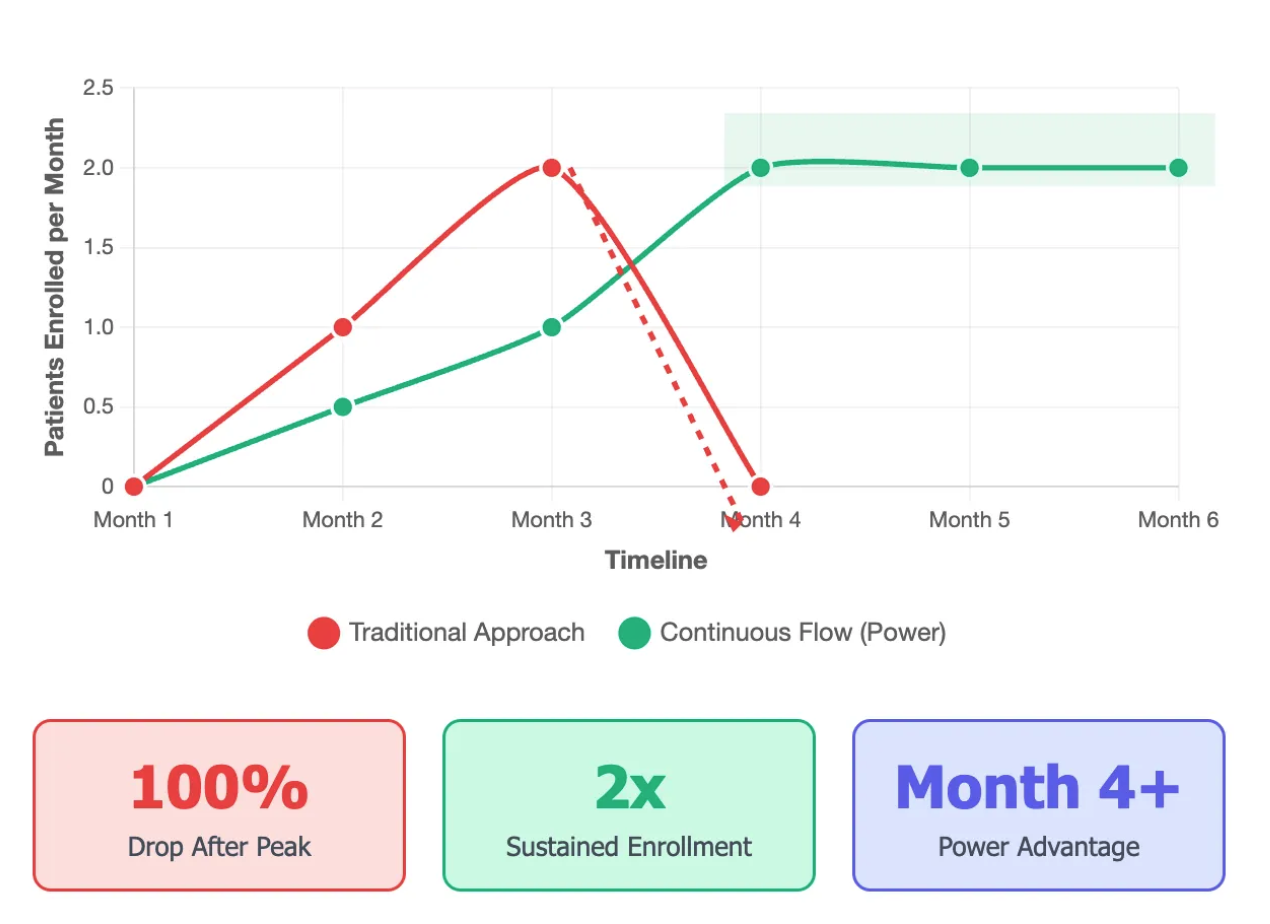
Here's a pattern we see across hundreds of trials: strong start... steady month 2... then plateau. By month 3, enrollment rates drop 32% (on average) and rarely recover.
Why Does This Happen?
The "Low-Hanging Fruit" Effect:
- Month 1-2: Sites enroll their known patients
- Month 3: The existing pipeline dries up
- Month 4+: Scramble mode begins
Think about it — most sites have a short list of 2-3 patients they've been treating who might qualify. Phone call, quick consent, enrolled. But once that list is exhausted? That's when the real work begins, and most sites aren't prepared.
Traditional Response (That Doesn't Work):
- Add more sites (3-month activation delay)
- Increase advertising spend (diminishing returns)
- Pressure existing sites (burnout risk)
We've all been there. The sponsor calls: "We need more patients NOW!" So you throw money at the problem. New sites that won't see a patient for months. Facebook ads with 0.3% conversion rates. Weekly "motivation" calls that just stress out your coordinators. It's expensive theater that rarely moves the needle.
The Proactive Playbook
1. Build Continuous Flow from Day 1
Don't wait for the plateau. Starting immediately after Site Initiation Visit (SIV), while sites are enrolling their known patients, simultaneously build:
- Digital referral flow: Not one-off campaigns, but a steady flow of qualified referrals. Campaigns in bursts create long backlogs that burden sites. Instead, find ways to generate a continuous stream of referrals over time.
- Community awareness: Targeted outreach in areas where patients are already seeking care.
- Dynamic volume allocation: Directing patient interest towards clinics that are best at booking these patients to appointments.
2. The 60-Day Pipeline Metric
This changed everything for us. Track how many qualified patients each site has in screening/consideration. When this drops below 15, that's your early warning signal.
Why 60 days? Because that's how long it takes to build new recruitment channels. If you wait until the pipeline is empty, you're already 2 months behind.
3. Start Power Partnership from Site Initiation Visit
- Begin recruitment support immediately after SIV
- More time to optimize qualification cutoffs
- More time to train and coach sites
- Maximize enrollment delivery through early engagement
Real-World Example
We recently worked with a neuroscience trial facing the classic Month 3 cliff. By starting our digital patient identification system from Day 1 after SIV, we maintained a steady flow of pre-qualified patients. The site averaged just 0.1 patients per month industry-wide, but with continuous support, we helped them achieve consistent enrollment without the typical plateau.
The Math That Matters
If each site needs 10 patients (typical cap):
Traditional approach: 0 patients Month 1, 2 patients Month 2, 1 patient Month 3, then 0s for months.
Continuous flow: 1-2 patients per month, predictable completion.
That's not just faster — it's cheaper, less stressful, and produces better data.
Your Action Items
- Chart your last 3 trials' accrual curve (patients per site per month) — do you see the Month 3 dip?
- Calculate your current 60-day pipeline of patients in process
- Plan to start recruitment support from SIV — not Month 3
- Set up weekly pipeline tracking — not enrollment, but future pipeline. This is your early warning system.
The Bottom Line
Every trial starts with hope, but trials succeed or fail based on what happens when sites' initial patients are enrolled. The sponsors crushing their timelines aren't lucky — they're building recruitment infrastructure from Day 1, starting at Site Initiation Visit.
Next week: we'll dive deep into the 60-day pipeline metric — how to track it site by site, what numbers actually predict success, and why some sites maintain a healthy pipeline while others crash to zero.
Brandon Li · Co-Founder, Power
We analyze recruitment patterns from 600,000+ patients across Power. Talk to our team — reply with your biggest enrollment challenge and we might feature the solution in a future post.