Every (good) customer service organization knows exactly how their team performed today. Call recordings. Real-time coaching dashboards. Tools like Gong to review conversations. Even small e-commerce operations have live dashboards showing what's converting and what isn't.
Clinical research sites? They're often still managing enrollment through monthly status reports.
This isn't a minor operational inconvenience. It's a fundamental breakdown in how the industry collects, analyzes, and acts on the data that helps determine whether a trial successfully enrolls patients. When each day of delay carries a median estimated cost of more than $800K in combined direct costs and lost revenue (Tufts CSDD, 2024), that breakdown has a price tag.
The blindness starts at the site level. A coordinator takes a call. They ask screening questions. They either qualify or disqualify a patient. That interaction happens on an island. Site leadership often has little visibility into what was said, how the patient reacted, or whether unnecessary friction crept into the conversation.
The Information Asymmetry Problem
Site leaders often manage blind. They can't coach because they can't see. They can't improve what they can't measure. As Michael Gold, Chief R&D Officer at Compass Pathways, put it on our podcast: "If you're blind to the data, I'm operating completely blindfolded."
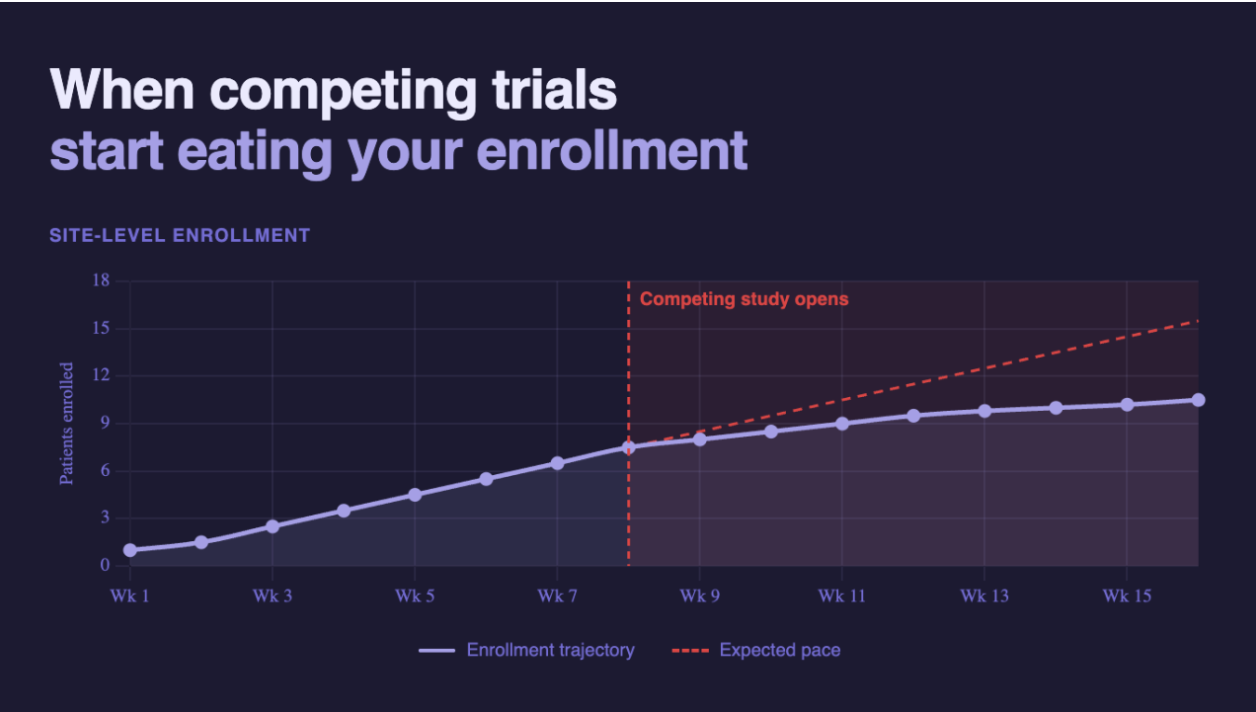
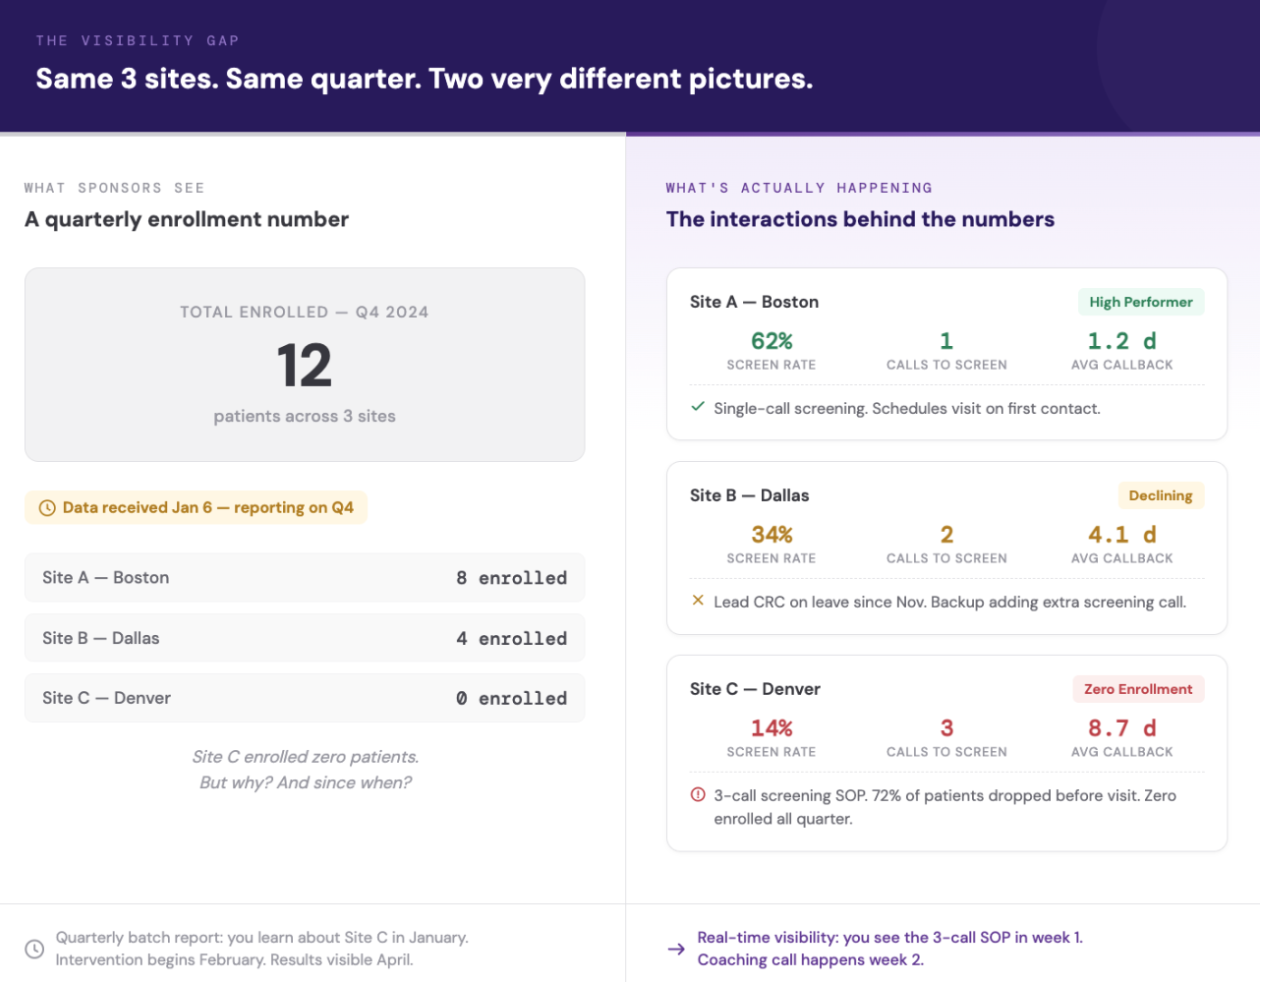
Push up to the sponsor level and the picture gets even less clear. Every sponsor knows their sites perform differently. Some are high performers. Some are disengaged. The question that oftentimes can't be answered with precision is: why?
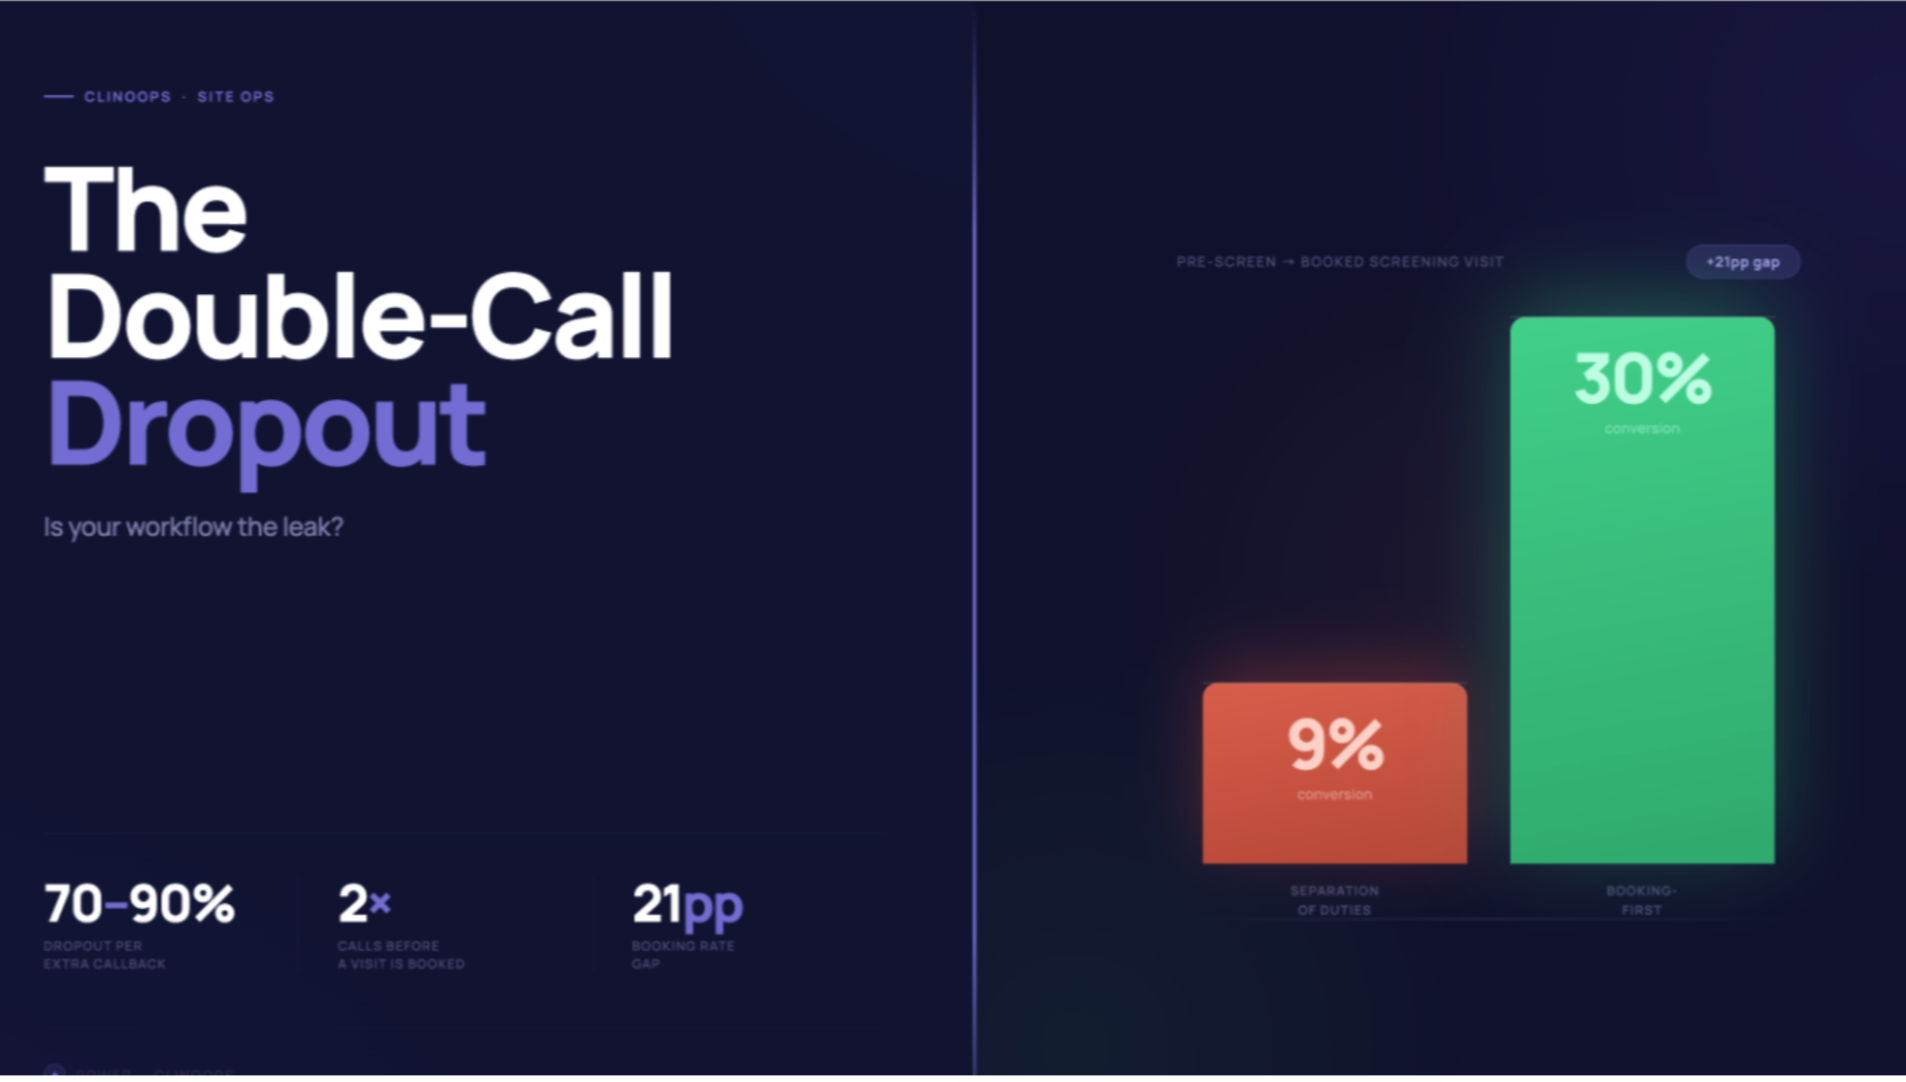
We discovered the answer was often hiding in plain sight. One largely invisible variable was driving substantial variance in site-to-site performance: screening practices. We found sites running two or three phone calls before inviting patients in were often unnecessary friction points that exhausted patients before they walked through the door. Meanwhile, other sites had one well-trained, efficient screening call.
Result? Those sites converted qualified patients at materially higher rates. But many sponsors couldn't see this variance because they had little visibility into how sites screened. They only saw the output — enrollment numbers — weeks after the fact.
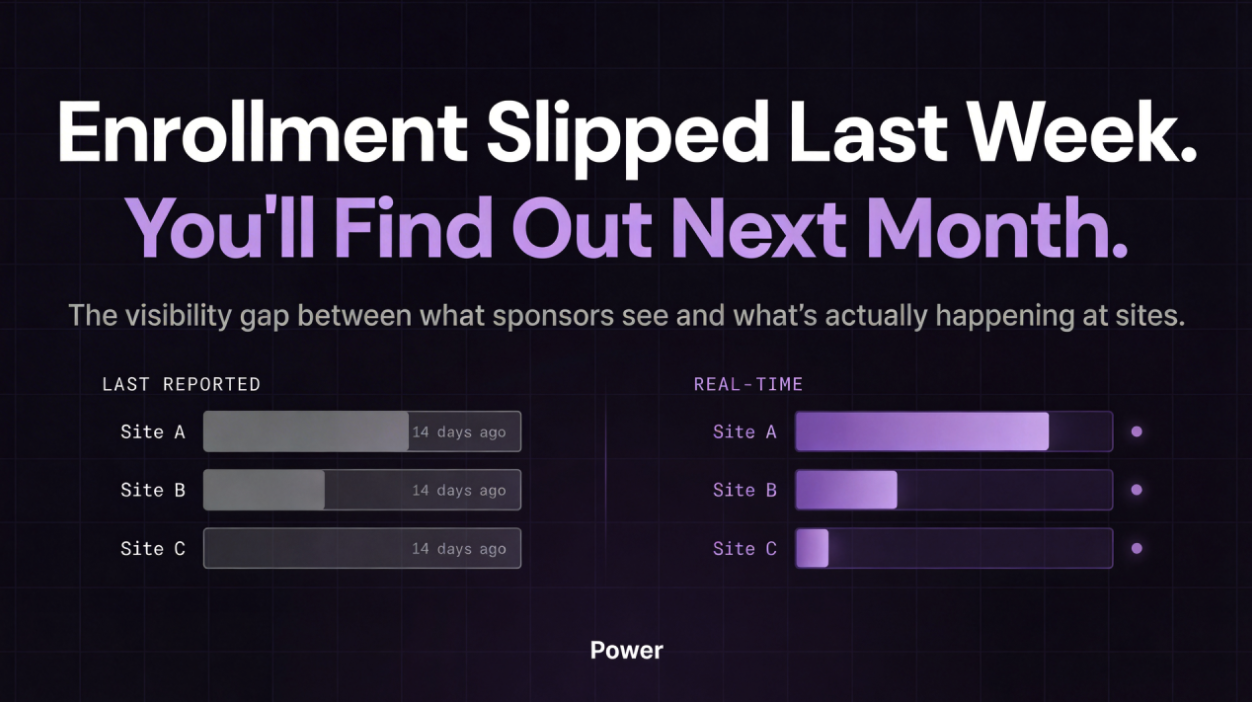
The Batch Reporting Trap
Today's industry standard is typically "batch updates." Weekly or monthly, sites fill out performance spreadsheets. Those reports get collated by CROs, turned into dashboards, and delivered to sponsors. Two potential issues to call out here.
First, the data isn't apples-to-apples. One site reports chart reviews as prescreening. Another counts a patient as prescreened only after direct contact. Same terminology. Different definitions. You're not analyzing performance… you're comparing noise to signal.
Second, feedback latency undermines momentum. When it takes a week or a month to gather feedback, it takes that long to act on it… and that long again to see results. That cascading lag is built into the entire enrollment timeline. By the time a sponsor notices a site is underperforming, they've already lost weeks of recruitment window.
Tufts CSDD data from nearly 16,000 sites across 151 Phase II/III trials illustrates the scale: 48% of activated sites enrolled zero patients or fell short of targets. Roughly 1 in 9 never enrolled a single participant.
Weeks matter. In clinical trials, that's enrollment you can't get back.
Reframing the Problem
Clinical trials are fundamentally a network optimization problem. Multiple nodes — research sites — each with constrained resources: time, screening windows, appointment slots, competing demands. Each site accesses different patient populations and often runs their own unique workflow. The input is potentially viable patient matches. The output is, eventually, enrolled patients.
Without real-time visibility into how efficiently each site is converting input to output (and why), you can't optimize the network. You can only… well, make an educated guess.
What Real-Time Visibility Actually Enables
When you capture real-time, apples-to-apples data across your entire network, you can actually see what's happening. Not what happened two weeks ago. What's happening now.
A site hits their learning curve and screening efficiency jumps. You see it immediately. You increase referrals because you know they have the capacity to handle more volume.
Conversely, a site's engagement drops — maybe the CRC went on vacation, maybe there's a staff change, maybe they're approaching enrollment caps. You see it immediately. You redirect resources to sites performing better right now.
This ebb and flow, this dynamic reallocation of resources based on real-time ground truth, is what keeps enrollment consistent. It's what separates programs that hit their timelines from programs that drag.
Sponsors and sites can't optimize a network they can't see. And right now, they're often operating on echoes.
Brandon Li is Co-Founder at Power, where we provide real-time performance monitoring across hundreds of sites. Want to see what this looks like in practice? brandon@withpower.com