Picture this: You're 4 months into recruitment. The numbers look fine — 42% to target, tracking well. You sleep soundly.
Then Site E calls. Their PI just went on medical leave. Site F's coordinator quit. Site O has been marking patients as "not yet contacted" for 24 days because nobody told them how to use the portal.
You've just lost 4+ weeks of enrollment from three top sites. And you had no idea it was happening.
Here's the thing: most sponsors are flying blind between monthly reports while their sites are silently drowning.
The $47 Million Wake-Up Call
Last year, I watched an Alzheimer's trial nearly implode. Not because of recruitment. Not because of protocol complexity. But because nobody noticed 2 of their 5 sites had basically stopped enrolling for 10 weeks straight.
The monthly reports? Showed decent progress. The sponsor calls? "Everything's fine."
Reality? Those sites were hemorrhaging patients while waiting for IT support, vacation coverage, and CRA visits.
The outcome: last patient shifted 5 months further back. The cost: $47 million.
What Actually Happens at Sites
We started tracking every single site's performance weekly. Not monthly. Weekly — and oftentimes daily. Like a coach checking their player's key performance metrics.
Here's what that looks like:
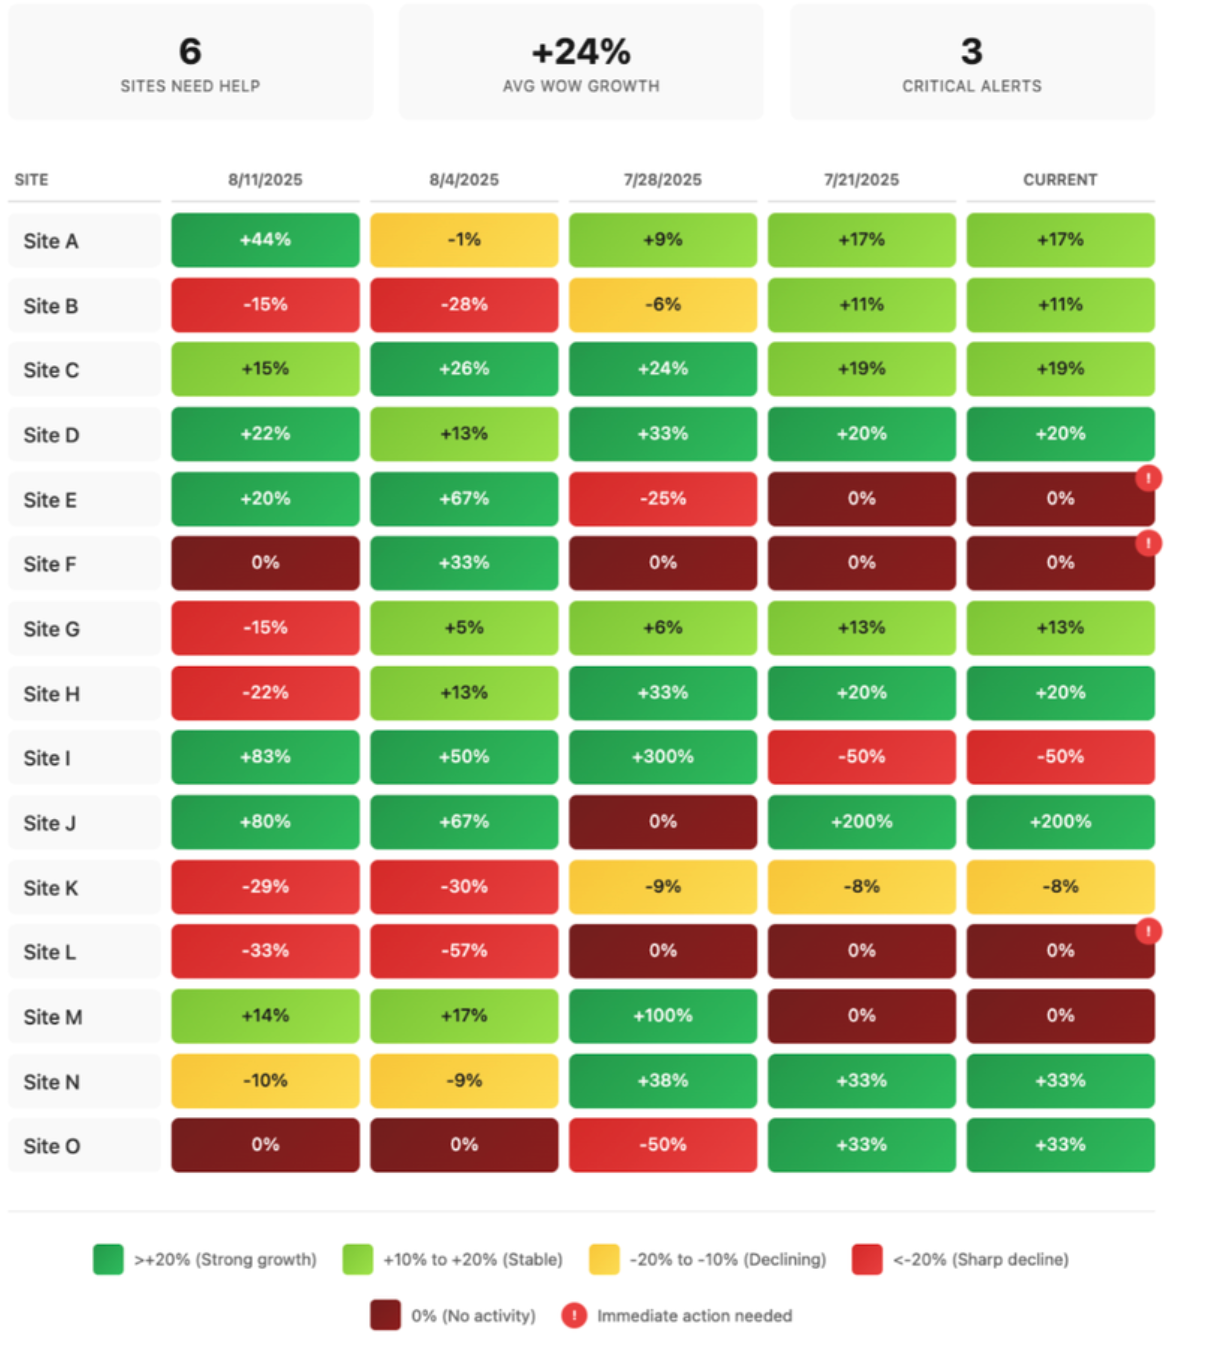
Look at Site E. Crushing it at +20%, then jumps to +67% growth... then suddenly drops to -25% and flatlines at 0% for weeks. The coordinator got promoted to a new role. Nobody was assigned to cover. 50+ patients and their progress — gone.
But here's the thing: we would have caught it when they hit -25%, not after weeks of zeros. And more importantly, it would have been prevented from happening to multiple other sites.
Why Sites Actually Go Dark
After tracking 600+ site crashes, here's what really happens:
The Vacation Vortex (31%) — Coordinator takes vacation. Backup doesn't know the password. Referrals pile up. When they return, all those patients have moved on.
Portal Purgatory (28%) — "I keep clicking save but nothing happens." Meanwhile 15 patients were stuck in "not yet contacted" for a month because the person in charge of checking the portal wasn't doing so.
Silent Overwhelm (23%) — The site takes on 3 new trials. Yours gets quietly forgotten. Too embarrassed to mention it on calls.
Permission Paralysis (18%) — The new coordinator needs access. IT ticket submitted. Still waiting 4 weeks later.
The 14-Day Rule
Here's the kicker: when a site goes red, you have exactly 14 days before enrollment crashes. Not 60.
Why? Sites usually have 2 weeks of patients already in screening. After that — empty pipeline.
Old Way (Monthly Reports):
- See problem: Week 10
- React: Week 11
- Fixed: Week 12
- Lost: 3-5 patients per site
Heat Map Way (Weekly Tracking):
- See problem: Week 2
- React: Same day / week
- Fixed: Week 2.5
- Lost: Maybe 1 patient
Quick win: Start tomorrow by tracking just ONE metric — days since last portal login. If it hits 5 days, make the call. This alone will catch 40% of enrollment drops.
Our Intervention Playbook
Site drops to yellow or red? Here's exactly what happens:
Hours 1-4: Quick pulse check. Text the coordinator: "Hey, noticed things look quiet… everything OK?" (73% of issues solved here)
Day 1: If no response, we call. Usually it's something simple. Password reset. Portal confusion. Quick screenshare fixes it.
Day 2-3: Still stuck? We dig deeper. Maybe someone's on vacation. Maybe they need training. We provide coverage or support.
Day 4-7: Site's back to green in 82% of cases.
Week 2: Follow up to ensure the fix stuck. Share learnings with other sites to prevent similar issues.
"Last month, we caught Site M at -15% and intervened. They're now back to +20% growth. That single catch saved 8 patients and $3M in timeline costs."
The Three Warning Signs
After thousands of sites, we can predict failures 2-3 weeks out:
- Response times slip from 24 to 72 hours → enrollment drops 50% within 3 weeks
- No portal login for 5+ days → 80% chance of unprocessed patients
- Screening ratios shift by >30% → something's broken in their process
What This Means for You
The math that made our CFO's jaw drop:
Without heat maps: 4-6 sites fail before you notice. 3-5 patients lost. 2-3 month delay. Cost: $15-20M
With heat maps: 1-2 sites caught early. 0-2 patients lost. No delay. Cost: <$1M in monitoring
ROI: 20x
Your Action Plan
This Week: Pull your site-level data. How many went dark without you knowing?
Next Week: Build a simple heat map. Red = <50% of target, Yellow = 50-80%, Green = >80%
Week 3: Call every yellow and red site. Not to pressure. To listen.
Week 4: Pick one early warning metric. Track it daily.
The Bottom Line
Stop treating enrollment like one big number. It's not. It's 15-50 individual sites, each with their own struggles, each capable of tanking your timeline if they go dark for just 2 weeks.
The sponsors hitting their targets aren't lucky. They just know what's happening at each site this week, not last month.
And here's the thing: when you catch a site struggling in week 1 instead of week 10, you're not just saving enrollment. You're saving the relationship.
Sites remember who helped them succeed.
Brandon Li · Co-Founder, Power
We monitor real-time performance for 500+ sites and have helped manage recruitment pipelines for 1M+ patients. Talk to our team about what we're learning.